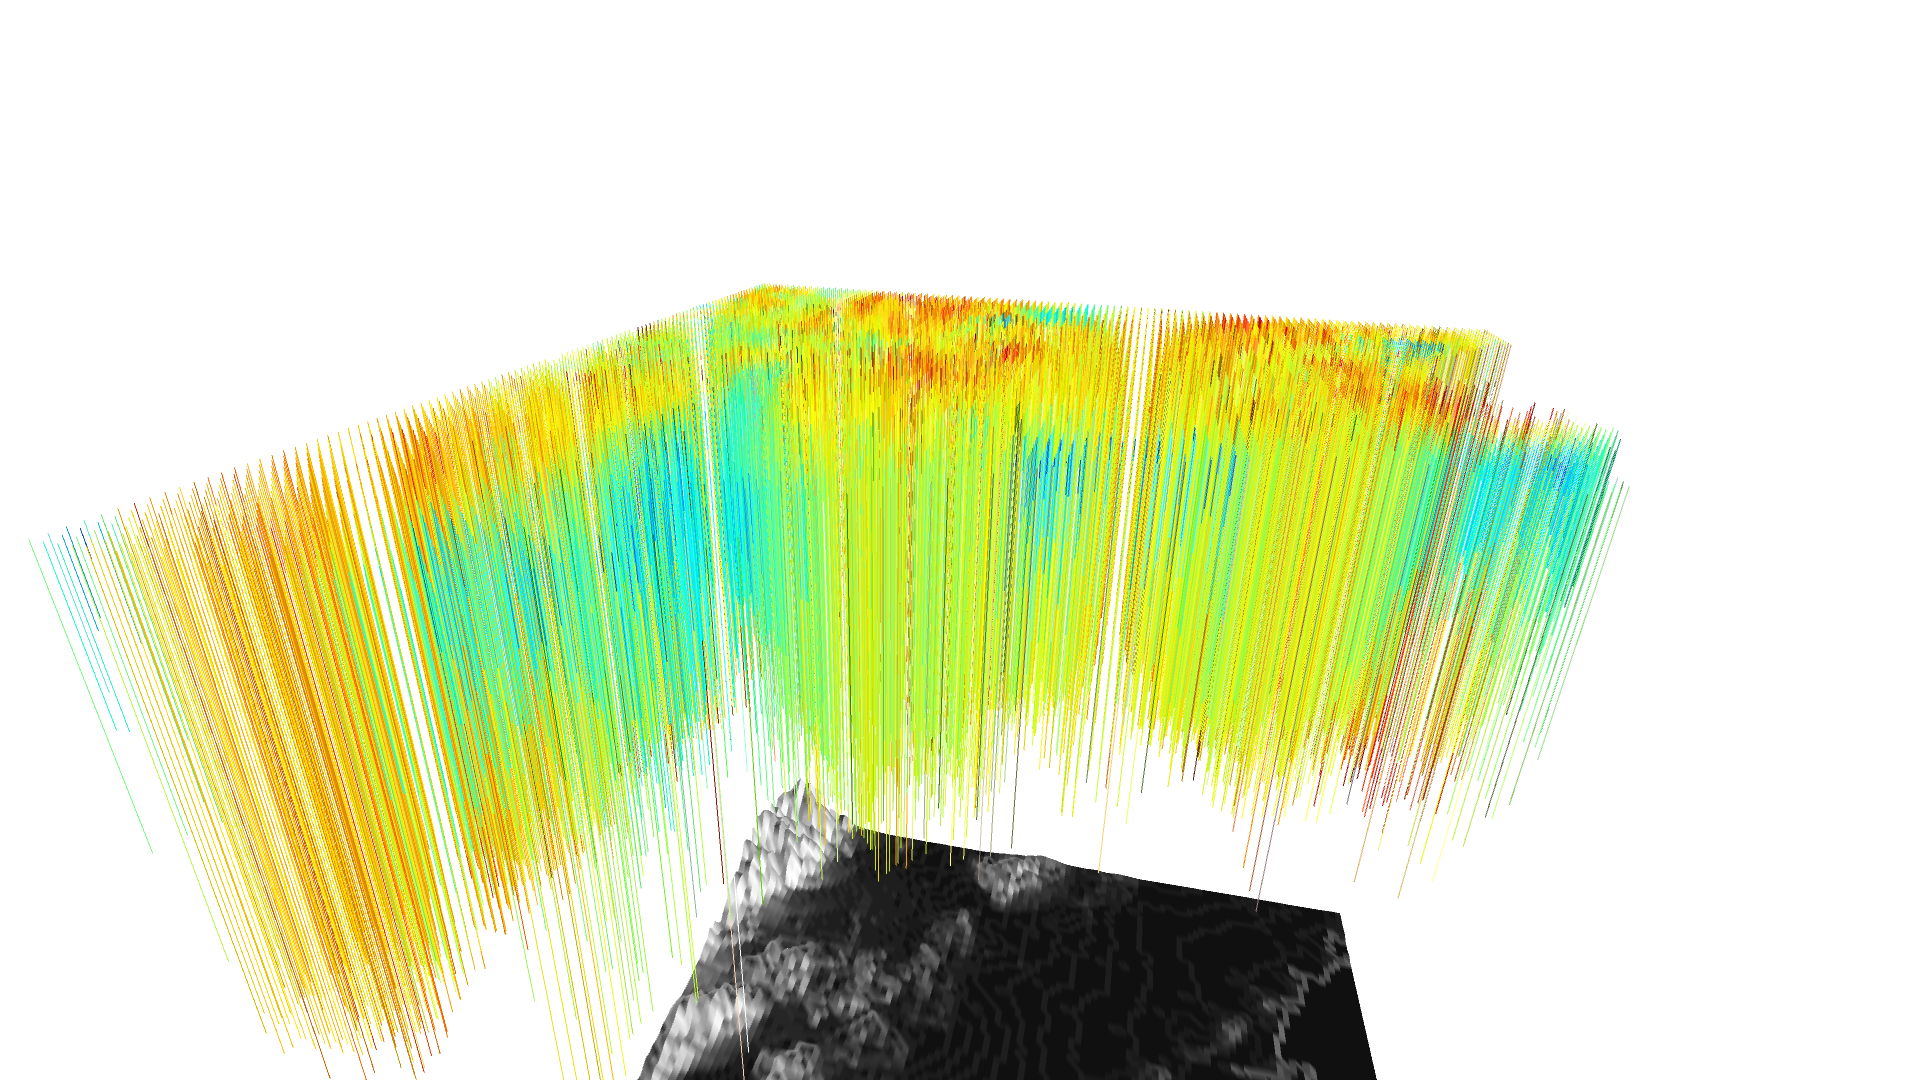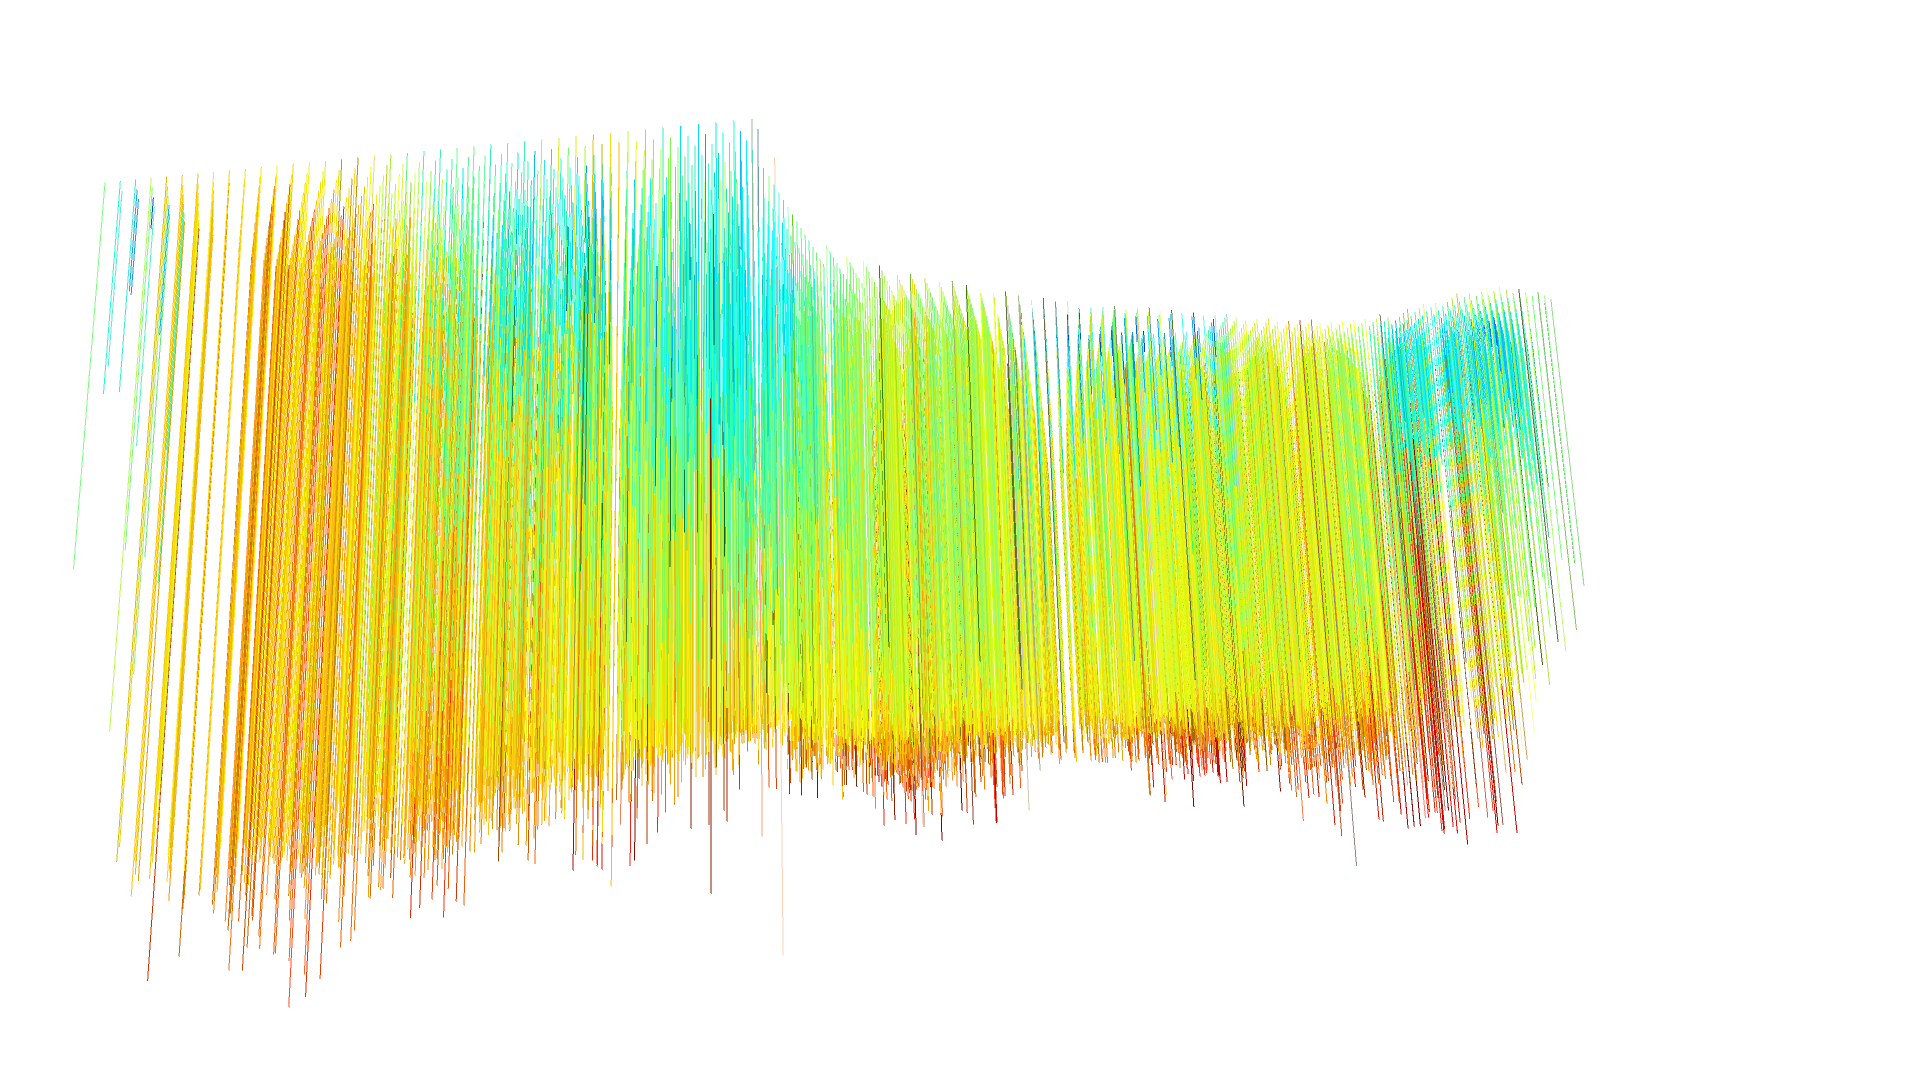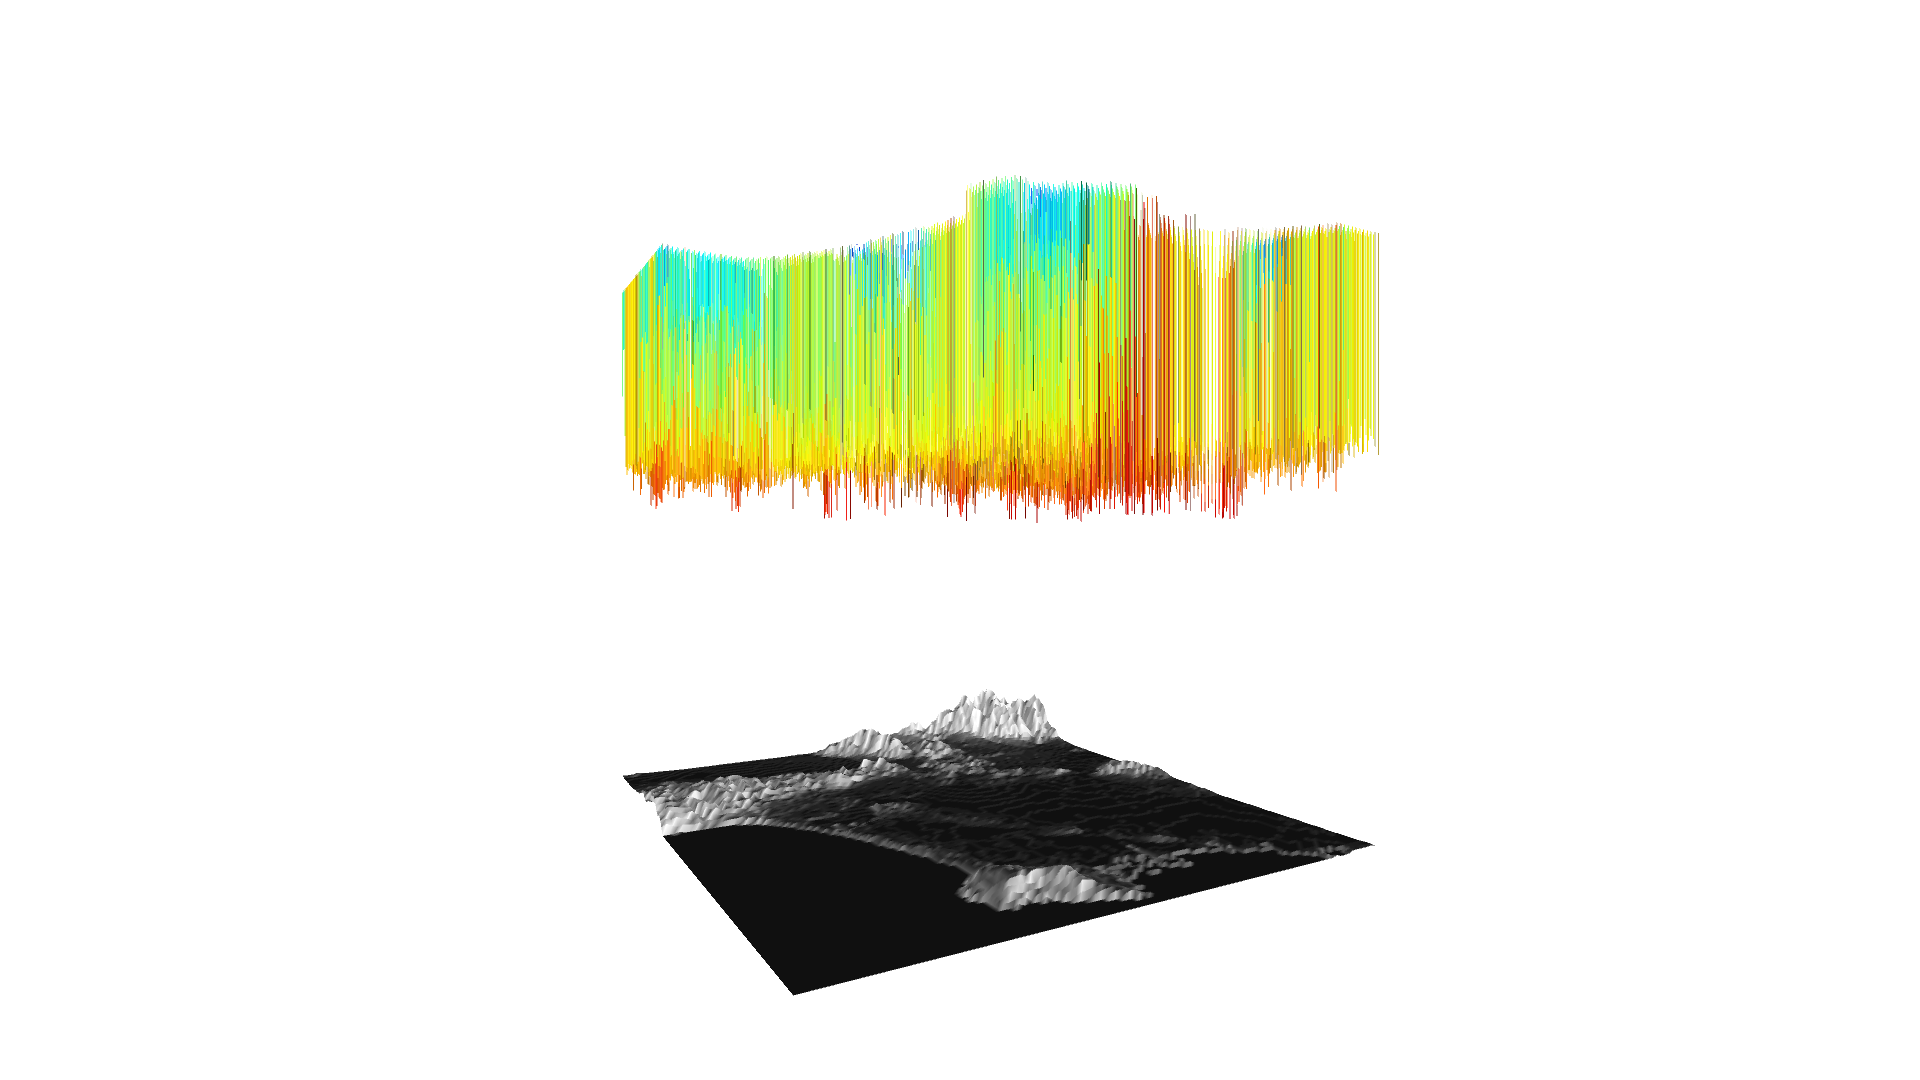
Project for IML 404: Tangible and Spatial Computing. This project explores the use of pixels and strategies for data visualization. I created a program that displays the connection between topography and its effects on climate. I used open-source depth maps and climate data, to create three-dimensional models that a user can interact with.