MA+P MA+P

Projects

Terrain

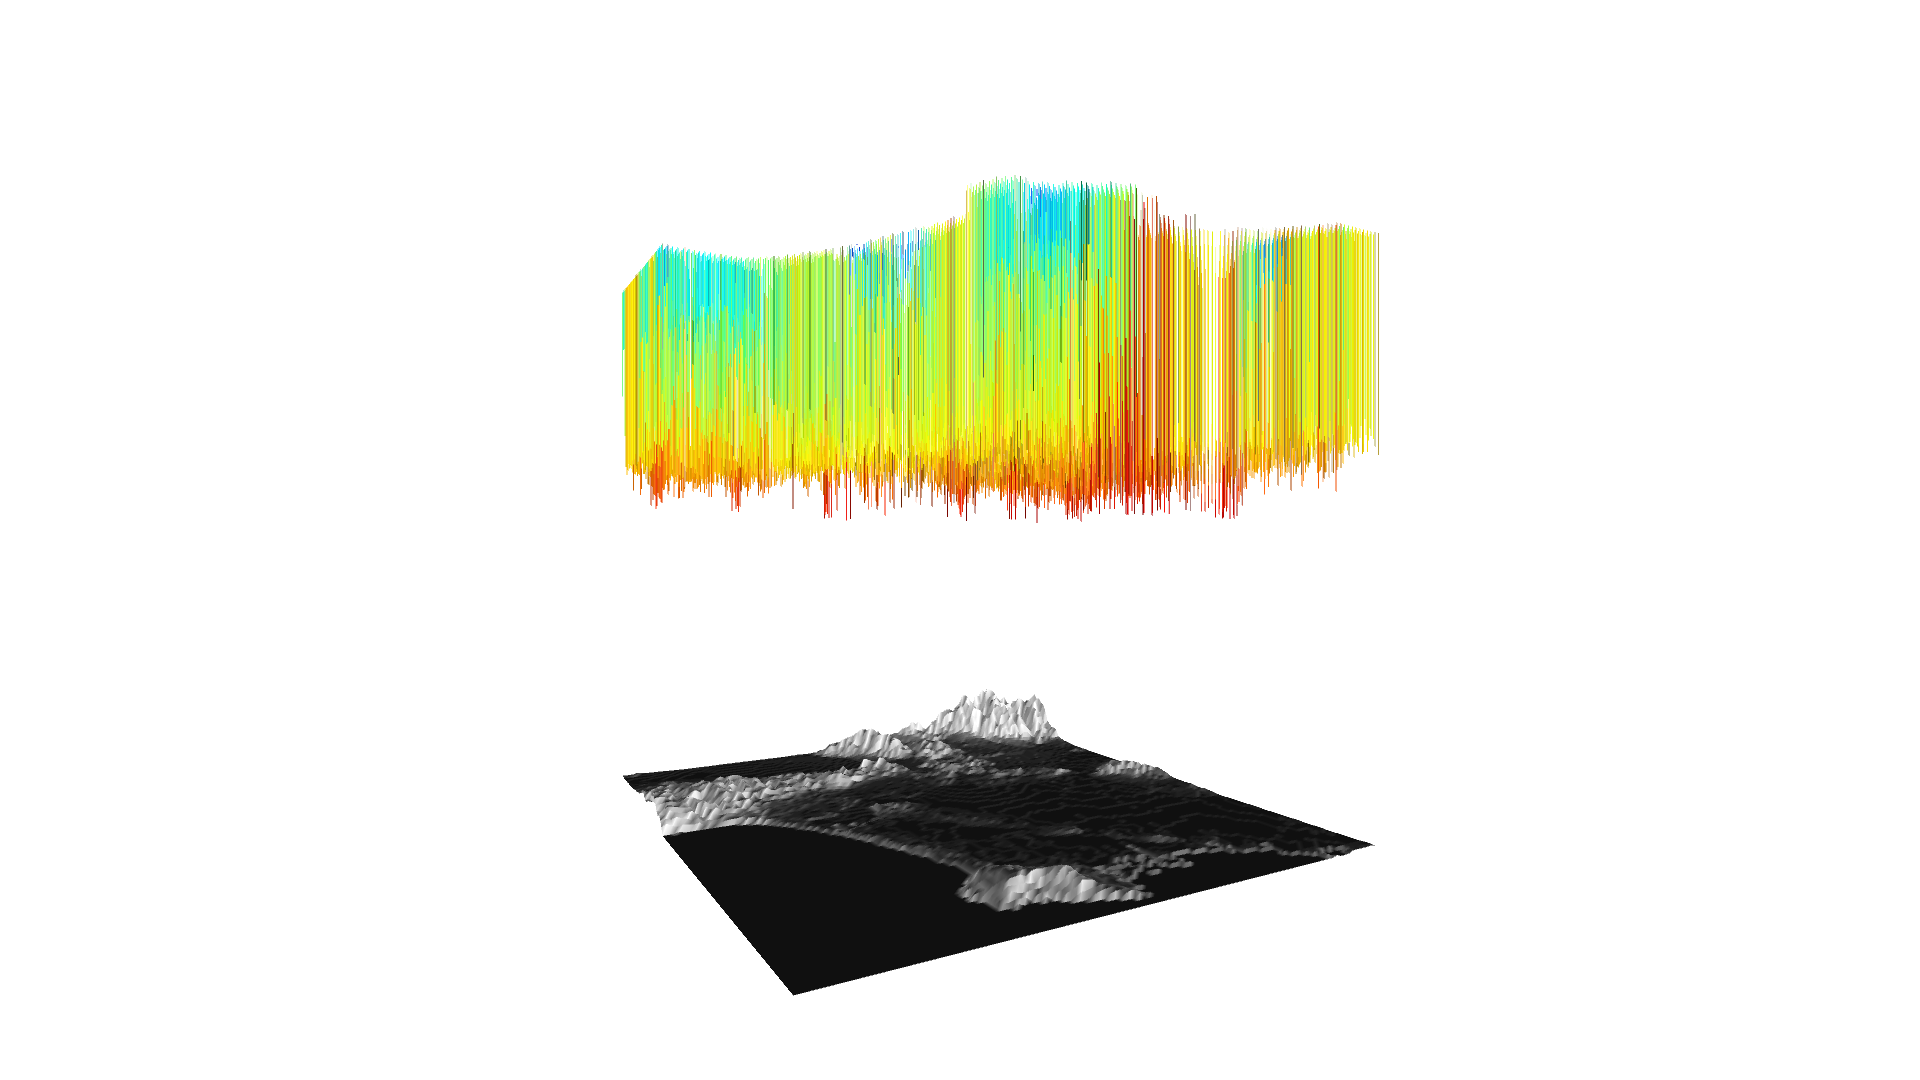
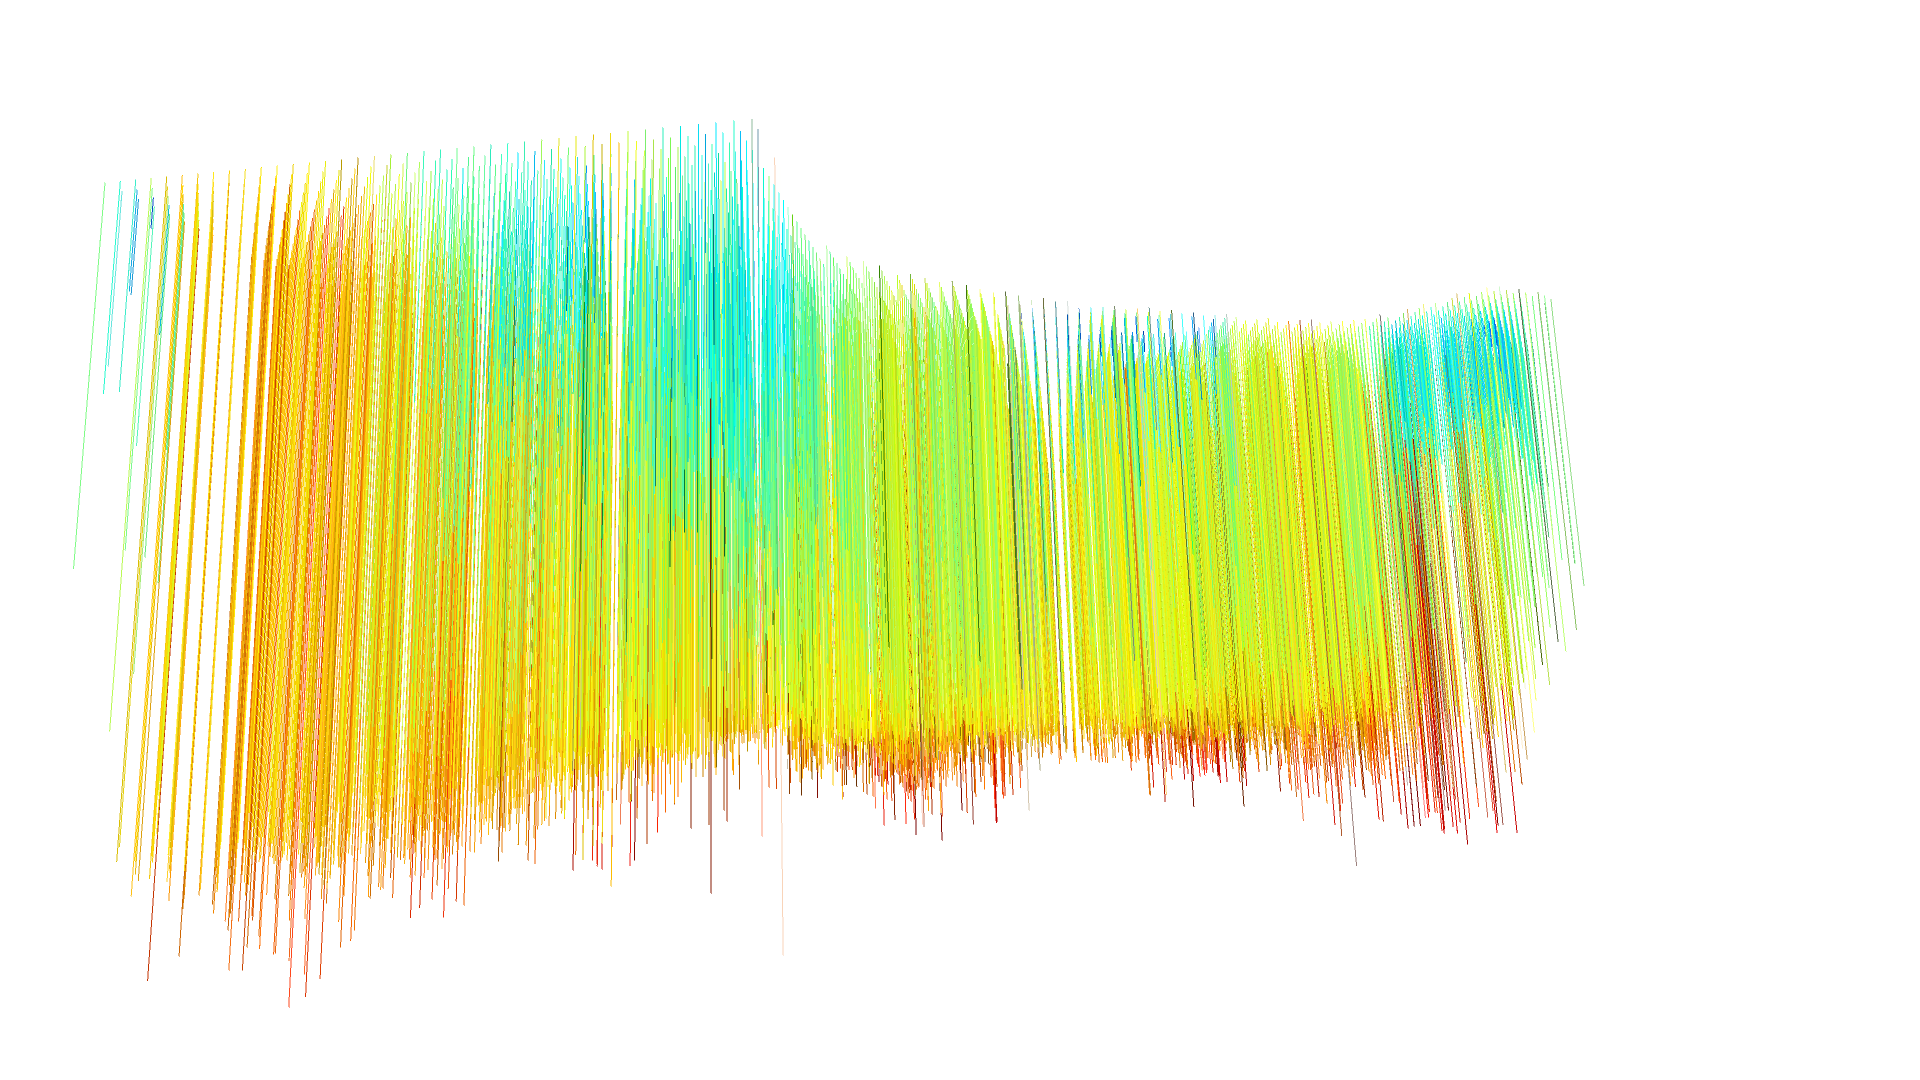
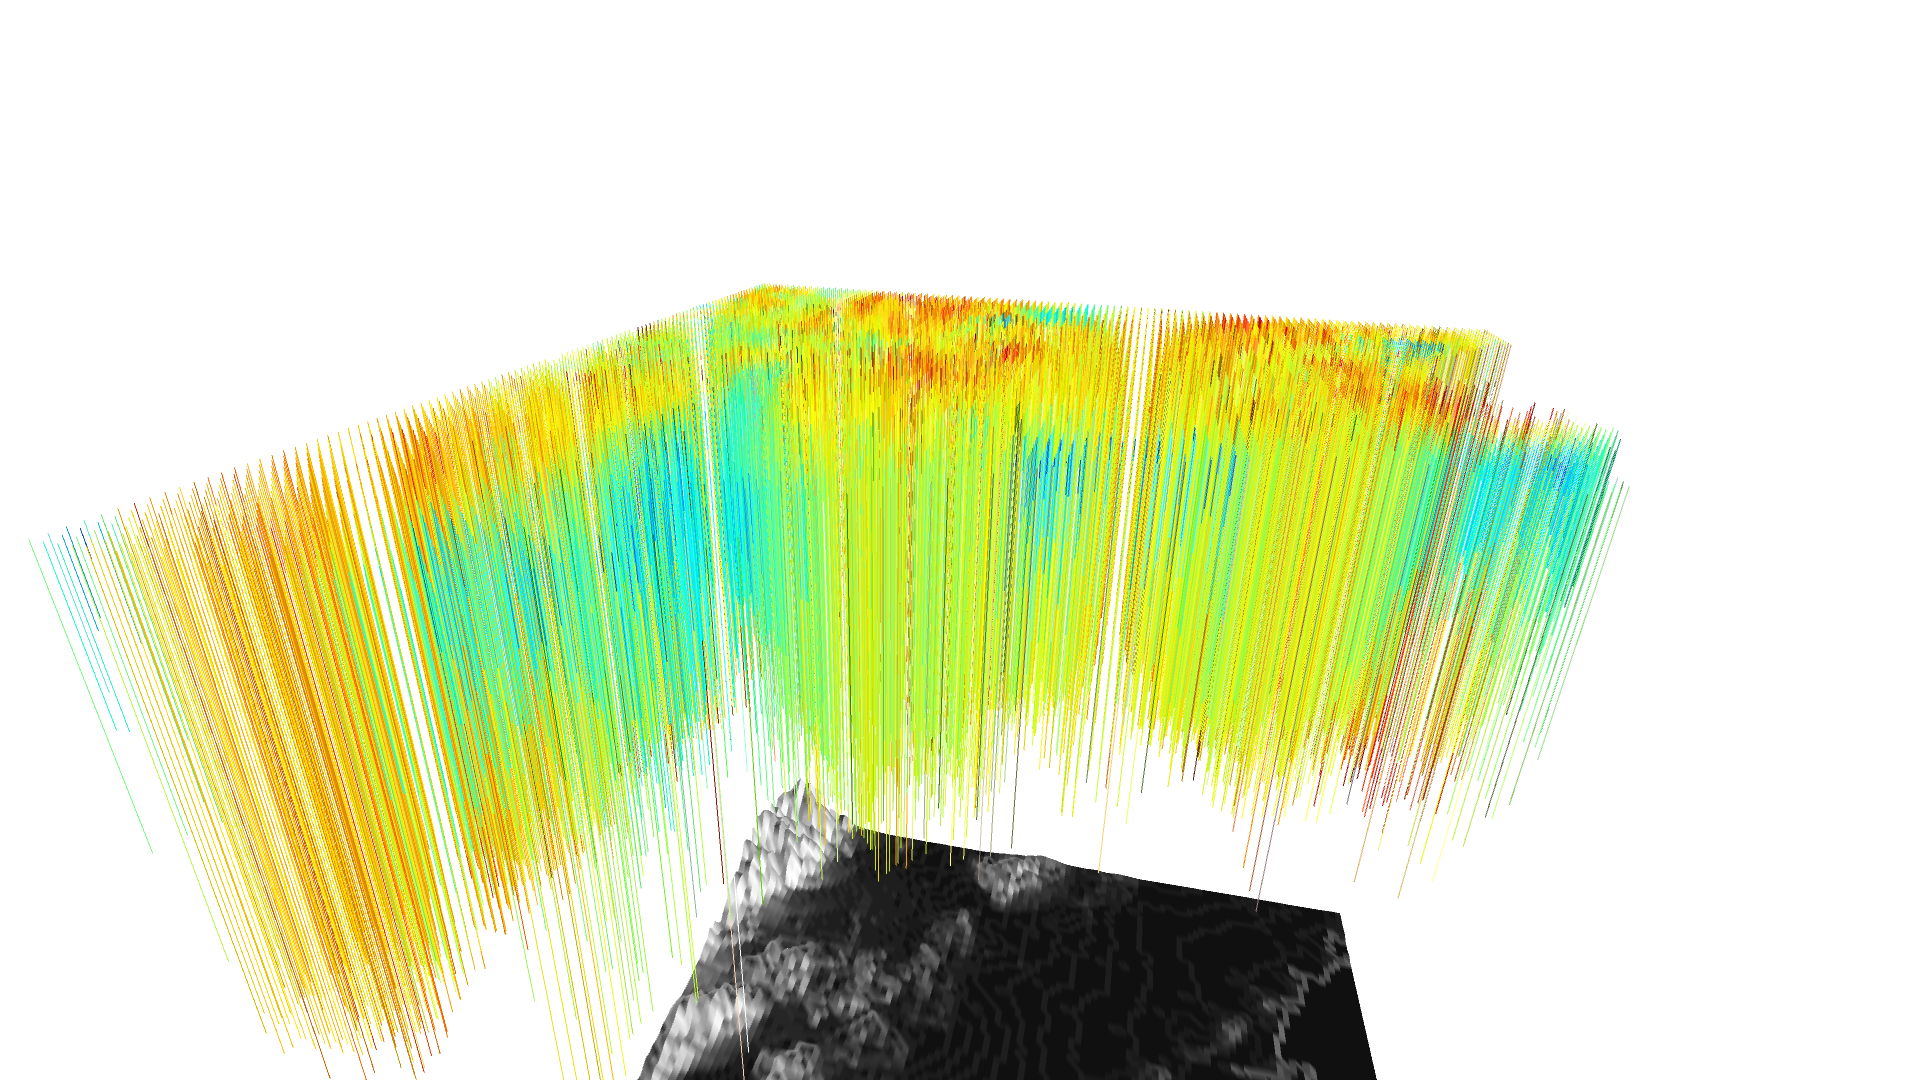
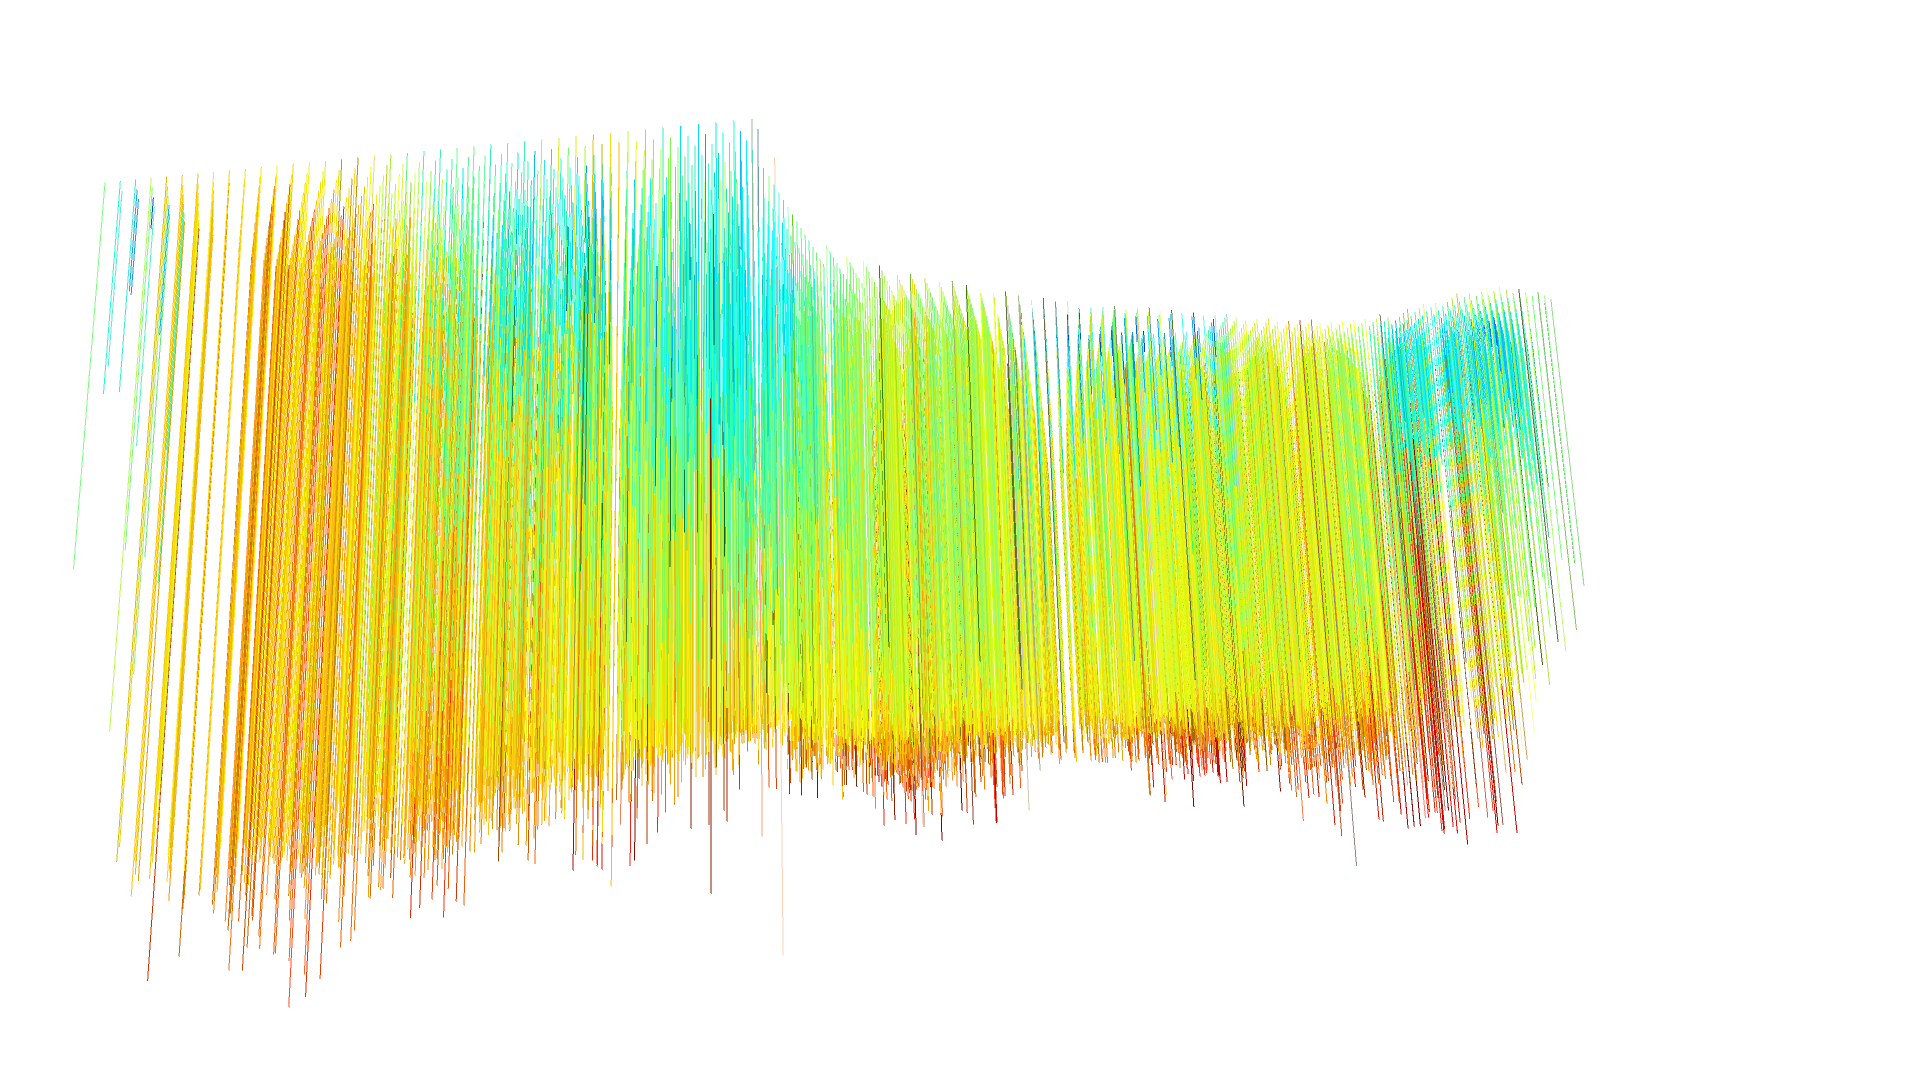
Project for IML 404: Tangible and Spatial Computing. This project explores the use of pixels and strategies for data visualization. I created a program that displays the connection between topography and its effects on climate. I used open-source depth maps and climate data, to create three-dimensional models that a user can interact with.

Project for IML 404: Tangible and Spatial Computing. This project explores the use of pixels and strategies for data visualization. I created a program that displays the connection between topography and its effects on climate. I used open-source depth maps and climate data, to create three-dimensional models that a user can interact with.
Project for IML 404: Tangible and Spatial Computing. This project explores the use of pixels and strategies for data visualization. I created a program that displays the connection between topography and its effects on climate. I used open-source depth maps and climate data, to create three-dimensional models that a user can interact with.
Project for IML 404: Tangible and Spatial Computing. This project explores the use of pixels and strategies for data visualization. I created a program that displays the connection between topography and its effects on climate. I used open-source depth maps and climate data, to create three-dimensional models that a user can interact with.

Project for IML 404: Tangible and Spatial Computing. This project explores the use of pixels and strategies for data visualization. I created a program that displays the connection between topography and its effects on climate. I used open-source depth maps and climate data, to create three-dimensional models that a user can interact with.
Terrain

Luke Quezada
Spring 2020
Coding, Design, 3D

Project for IML 404: Tangible and Spatial Computing. This project explores the use of pixels and strategies for data visualization. I created a program that displays the connection between topography and its effects on climate. I used open-source depth maps and climate data, to create three-dimensional models that a user can interact with.
×
ACCESSIBILITY
DESATURATE
Less intense colors.
COGNITIVE DISABILITY
Zoom in, important elements highlighted.
LOW VISION
Zoom in, more intense colors.
ADHD FRIENDLY
Zoom in, more intense colors, reading mask.